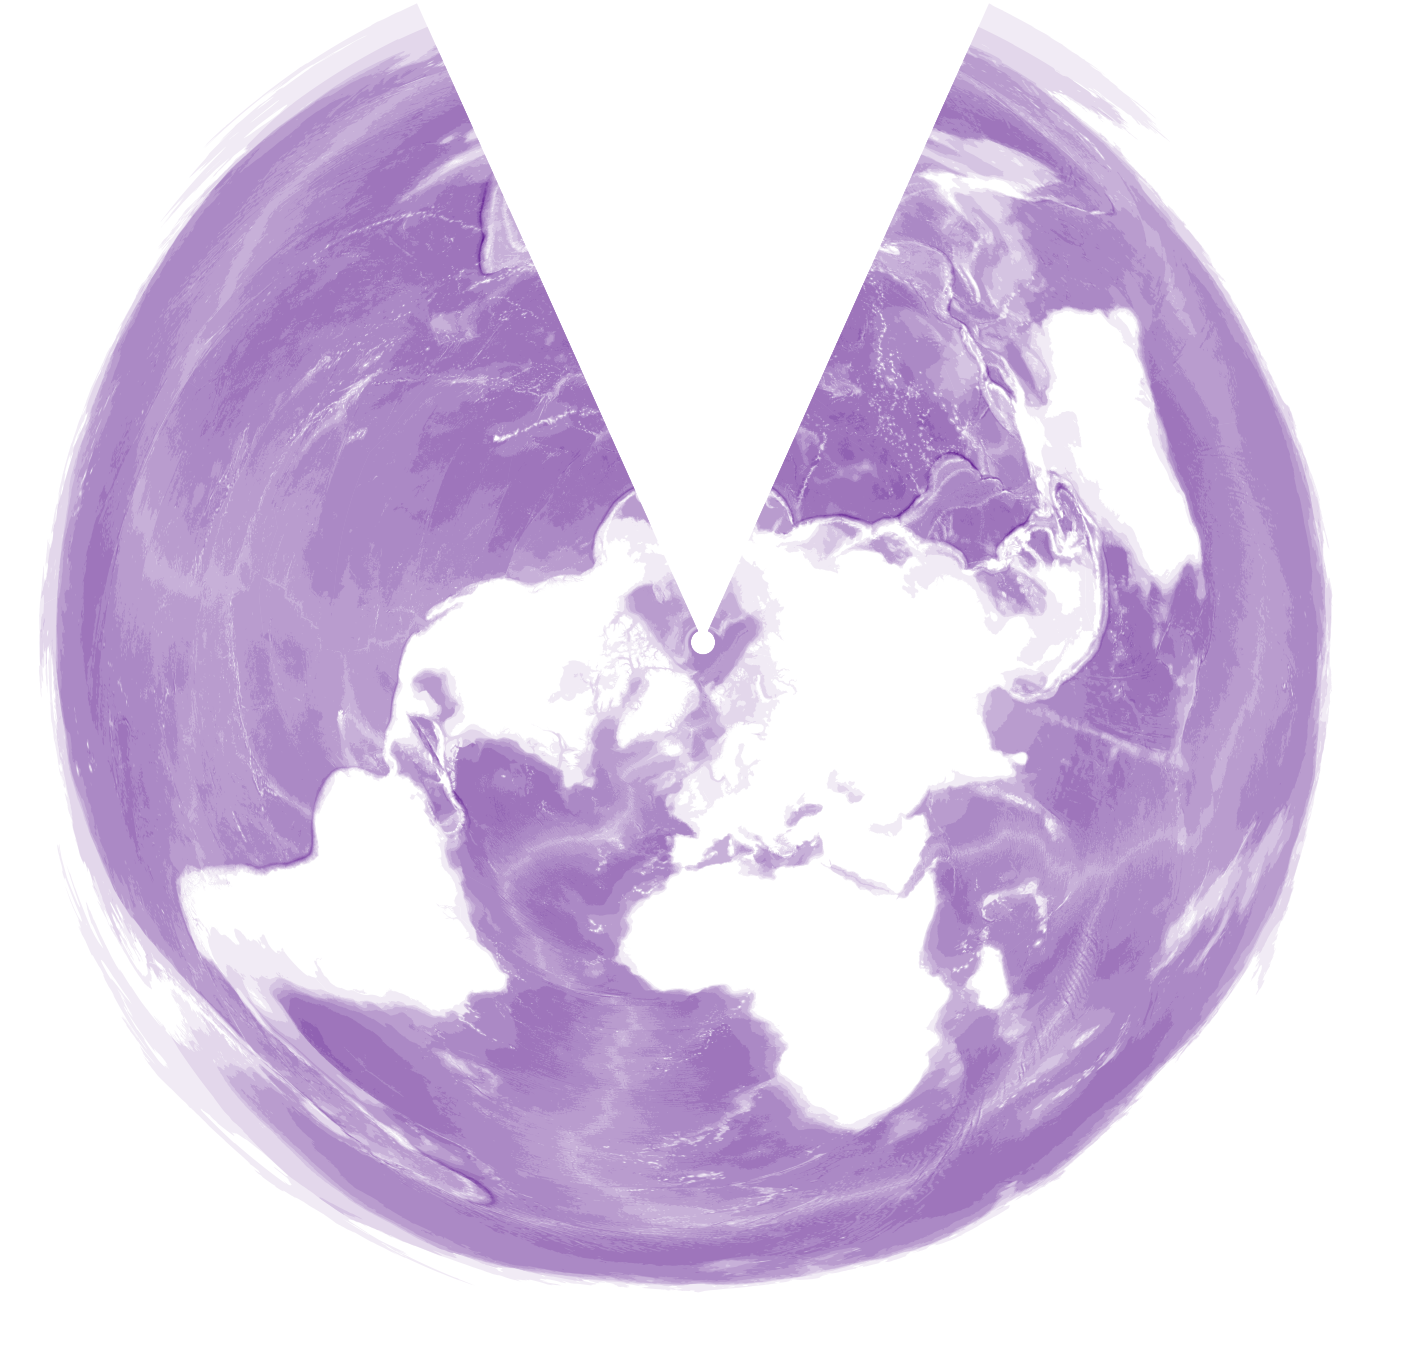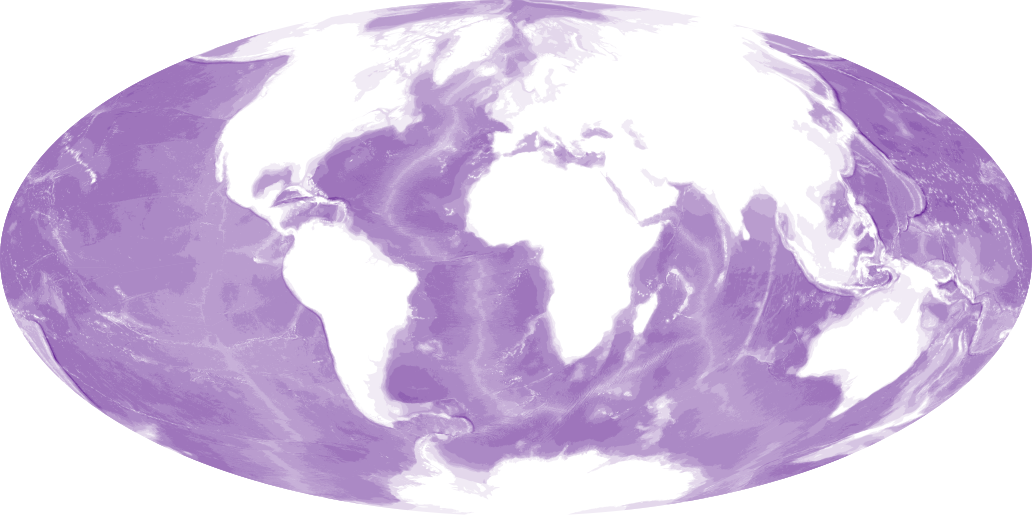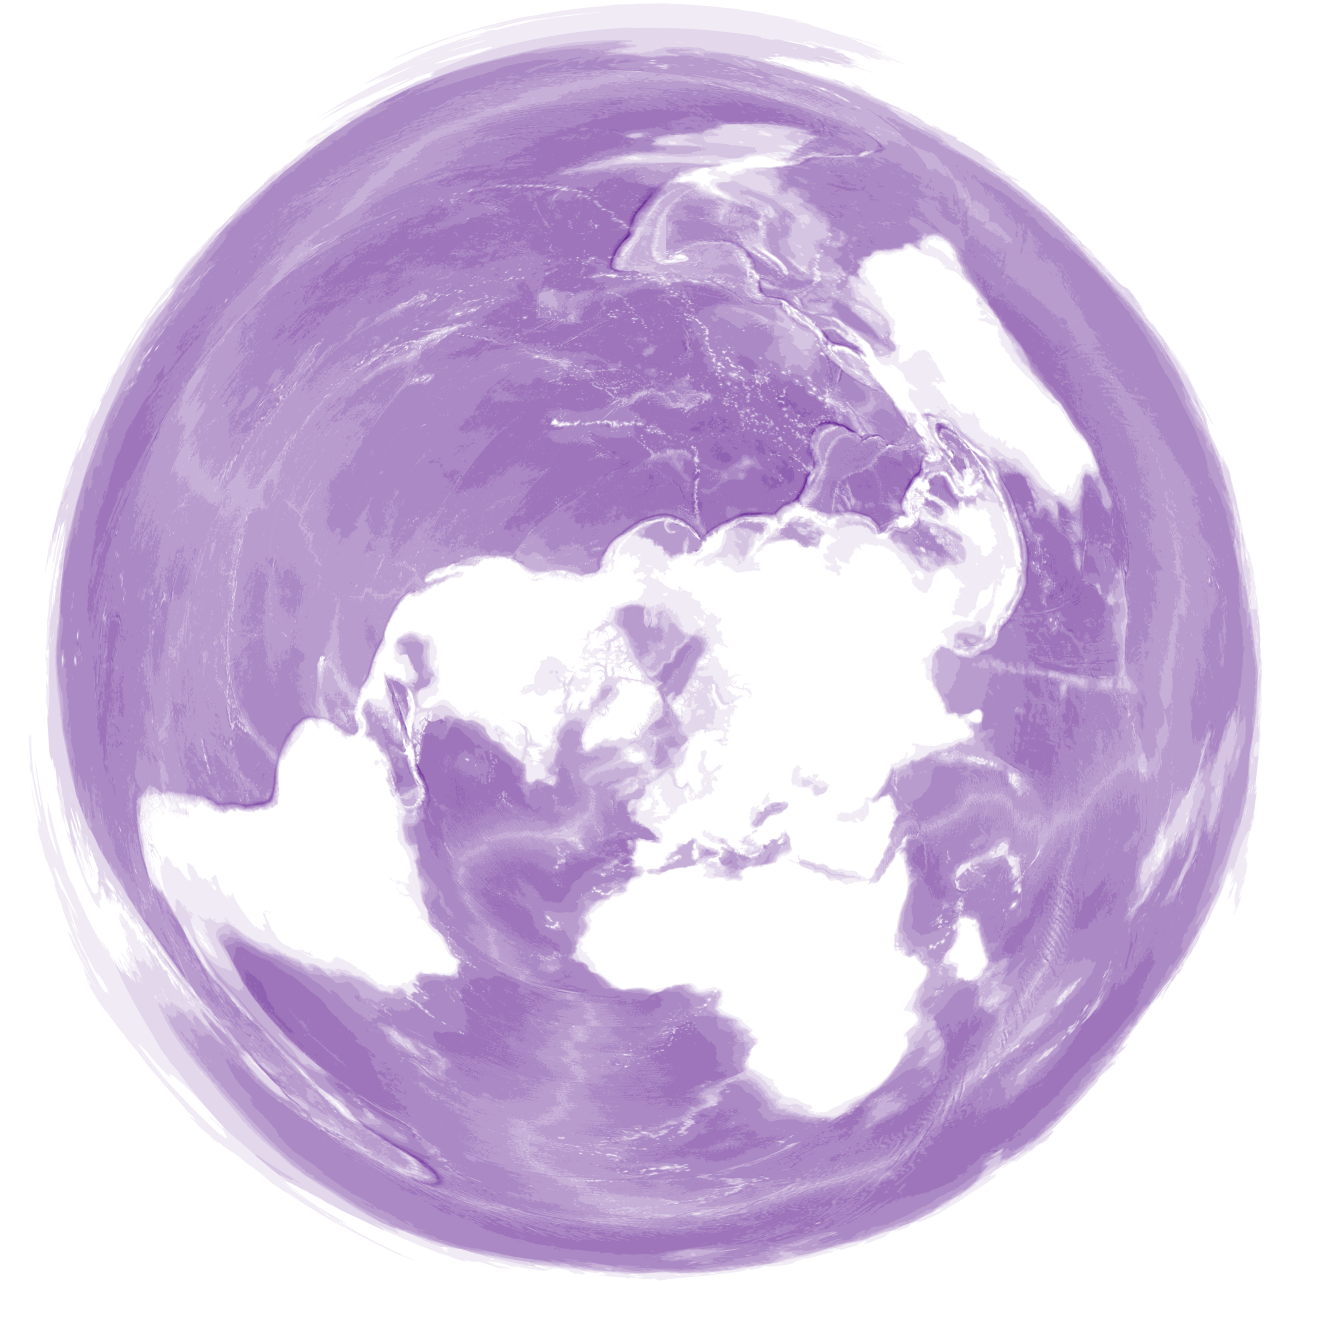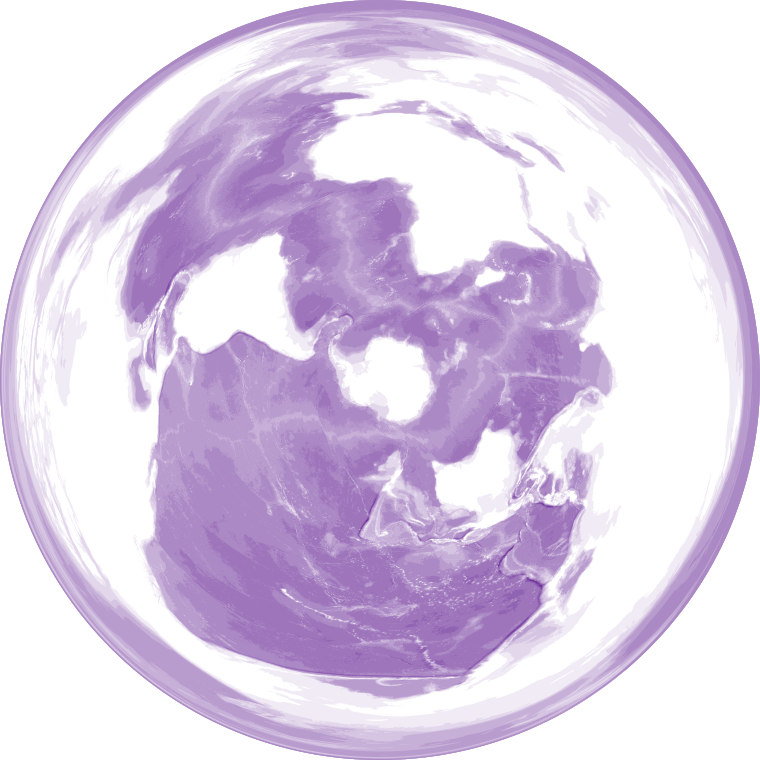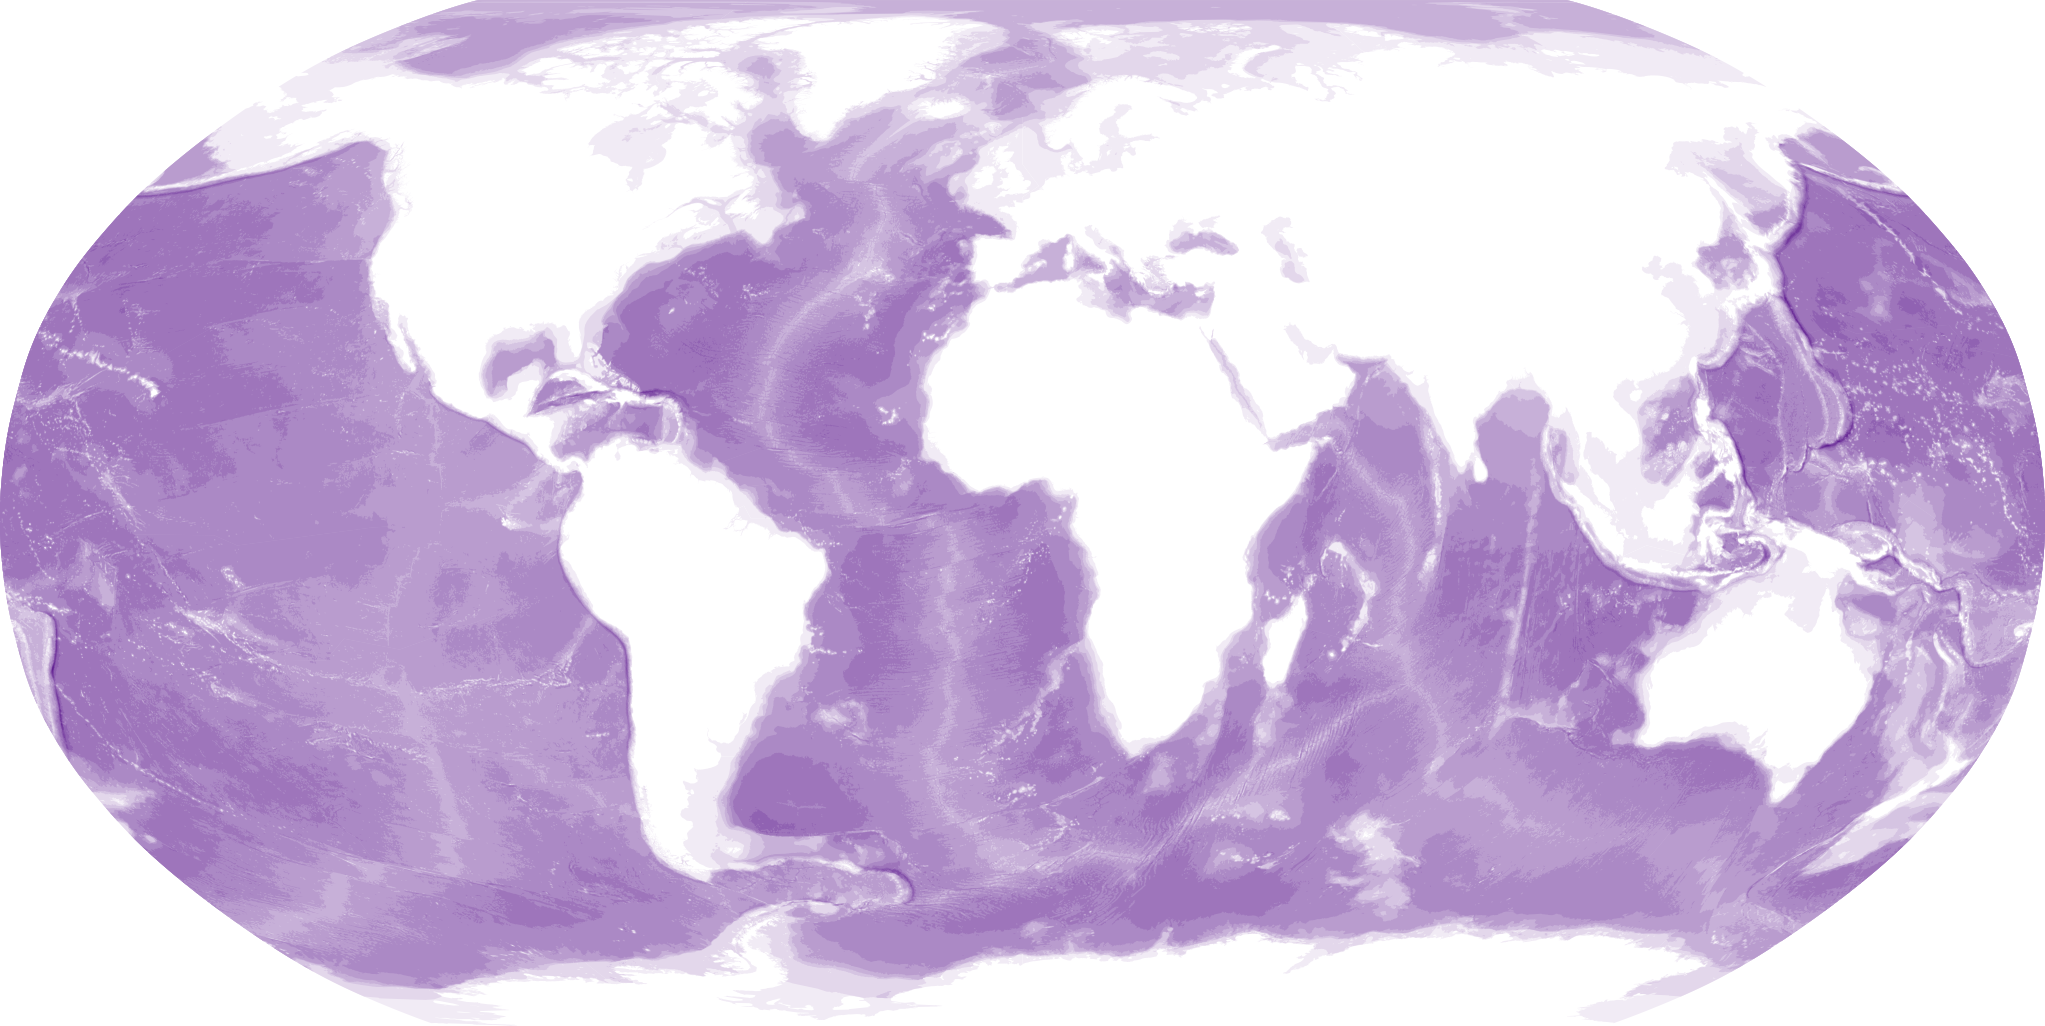
These maps show global bathymetry data from Natural Earth in five projections: Robinson, World Equidistant Conic, Aitoff, North Pole Azimuthal Equidistant, and South Pole Azimuthal Equidistant. I made these maps using QGIS and exported them as static images.
The bathymetry data from Natural Earth comes as a series of nested polygons at depths of 0, -200, -1,000, -2,000, -3,000, -4,000, -5,000, -6,000, -7,000, -8,000, -9,000, and -10,000 meters. I symbolized each layer on a continuous color scale (lighter purple = less deep, darker purple = more deep) and then placed the layers on top of each other.
A projection is a way to represent a 3D object (like the planet) on a 2D surface (like a map). Every projection is a compromise: there are infinite ways to display the Earth, but each of them introduces one or more vectors of distortion. Some map projections preserve directionality and angles, but distort the relative size of the objects on the map (like Mecator, which stretches towards the poles and squishes in the middle). Others preserve land area, but distort the shape of features (like Peters). Most maps we see these days are in Spherical Mercator, the most popular projection for web and mobile maps. But maps are for more than just getting from one place to another, and different projections can highlight other aspects of your map that are more important for your use case.
Click each image for full size.